 Are you looking at your author website analytics? What is it telling you? Might you be missing some important clues?
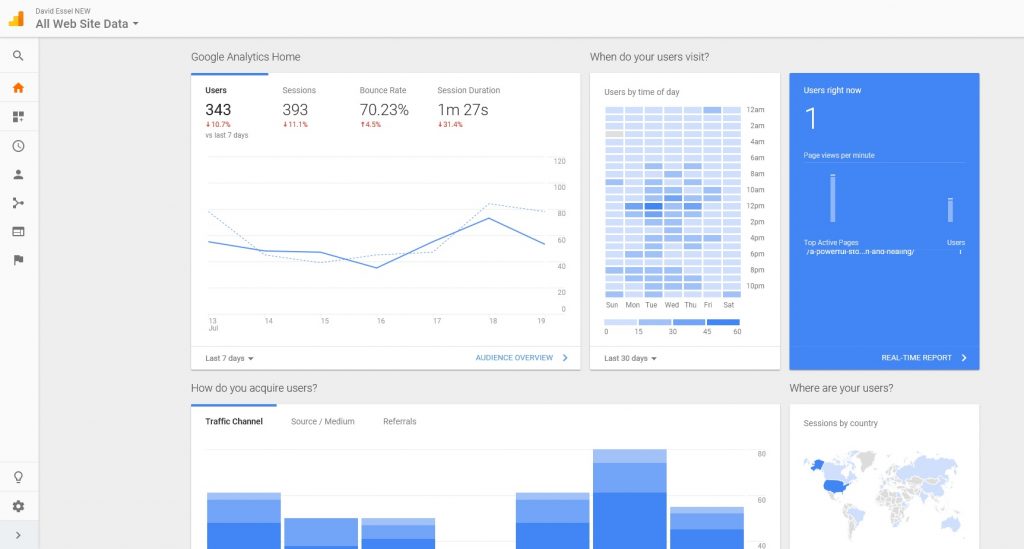
I’ve written other blog posts before about viewing analytics. I’ve talked about what to look at and what it means. After all, too many authors can’t really tell you what “bounce rate” is or how to define a conversion. But that’s not the point of this post. No, what I’m talking about today is some of the hidden messages that you might not notice when you look at your analytics report.
Here are a few things to keep an eye out for on your author website analytics report, and what those stats might really mean…
1. Total visitors over the last six months. Total visitors is probably the thing that everyone looks at first in their author website analytics. But have you looked at it as a trend? Compare this month to last month. Then compare it to six months ago. Occasionally, you may want to compare it to a year ago. Only by looking at this data over a period of time can you pinpoint if you’re getting better or worse in terms of traffic. You may also want to look at your traffic on a daily basis. What was your highest trafficked day of the month? What do you think made it the highest? This can be a clue to what’s working and what’s not on the traffic driving front.
2. Site content. This allows you to see the pages on your site that get the most traffic. And what’s here might surprise you. For example, you may discover that a whopping amount of your traffic goes to the homepage. Other authors see exactly the opposite: they notice that their blog posts are the primary traffic drivers and that hardly anyone even sees their homepage. This can give you a clue as to how people are finding your site and what they’re doing when they’re there.
3. Time on site/bounce rate. It’s great that you’re getting traffic to your site. But are those people staying on the site? Your author website analytics report will tell you how long people stay per visit, how many pages they visit, on average, and how many people “bounce” (i.e. visit one page and then leave). This will give you a good idea of your website’s stickiness. In other words, if they’re simply arriving and leaving (i.e. bouncing) you may not be doing a good enough job selling yourself or your book.
4. Exit rate per page. Similar to time on site, this data can tell you which pages on your site people are leaving. In other words, if you notice that 70% of the people that leave your site do so from the “About the author” page, then maybe that means that the page doesn’t have enough links on it. Or maybe it doesn’t entice people to learn more after they’ve reached the bottom. By really studying which pages people are leaving, you can figure out where to focus your efforts to keep people engaged.
5. New vs. returning users. How many people visited your site last month? How many people visited more than once? This is an important metric, because it tells you whether people are stumbling upon your site by accident or if they intentionally come back on a regular basis because you had an impact on them. The most common reason for return visitors on author sites is a strong blog series and/or email newsletter. If one of your goals is to develop a fanbase that will follow you, then having a low percentage of returning users should be a concern.
6. Technology. What platforms are people visiting your site on? What platforms are they LEAVING your site on? In other words, if 55% of people visit your site on mobile and the exit rate on mobile is significantly higher than desktop, then that may be a sign that your site isn’t easily usable to the mobile audience.
7. Acquisition channels. Where is your traffic coming from? In an ideal world, your traffic is nicely divided among the three primary sources: organic search, social and direct traffic (i.e. people typing in your URL). The reason it’s nice to have these balanced is that if one falls off, your site still has other traffic sources. So if, for example, Google changes their algorythm and your site falls from page 1 to page 5 on a search result, you will still have social to keep you afloat. If you look at these stats and one is significantly higher than the other two, you might want to invest some time in finding a better balance.
8. Site speed. I talk about site speed a lot. That’s because so many authors I’ve worked with value site design over site speed. But a slow site can seriously increase your bounce rate. It can also hurt your Google search results placement. If you haven’t taken a look at your site speed in your author website analytics report, now’s the time to do so. Make sure to delve into average site speed, site speed per page AND your site speed on different browsers. The numbers may surprise you.
9. Conversion rate. Many authors I work with don’t define a conversion on their site. And that’s quite a missed opportunity. Whether you consider a successful visit a book purchase, an email sign-up or something else entirely, how do you know if your site is achieving its goals unless you clearly define a conversion and track who converts? This can easily be set up in your author website analytics report. Keep an eye on your conversion data to keep track of what percentage of visitors are converting, which pages they tend to visit before converting, etc… This data can give you worlds of knowledge!
See, there’s probably a lot you can learn about what’s working — and what’s not — on your author website. You just have to know how to interpret the data.
If you want help getting your Google Analytics report set up properly, and help interpreting it, contact us today for a free consultation.